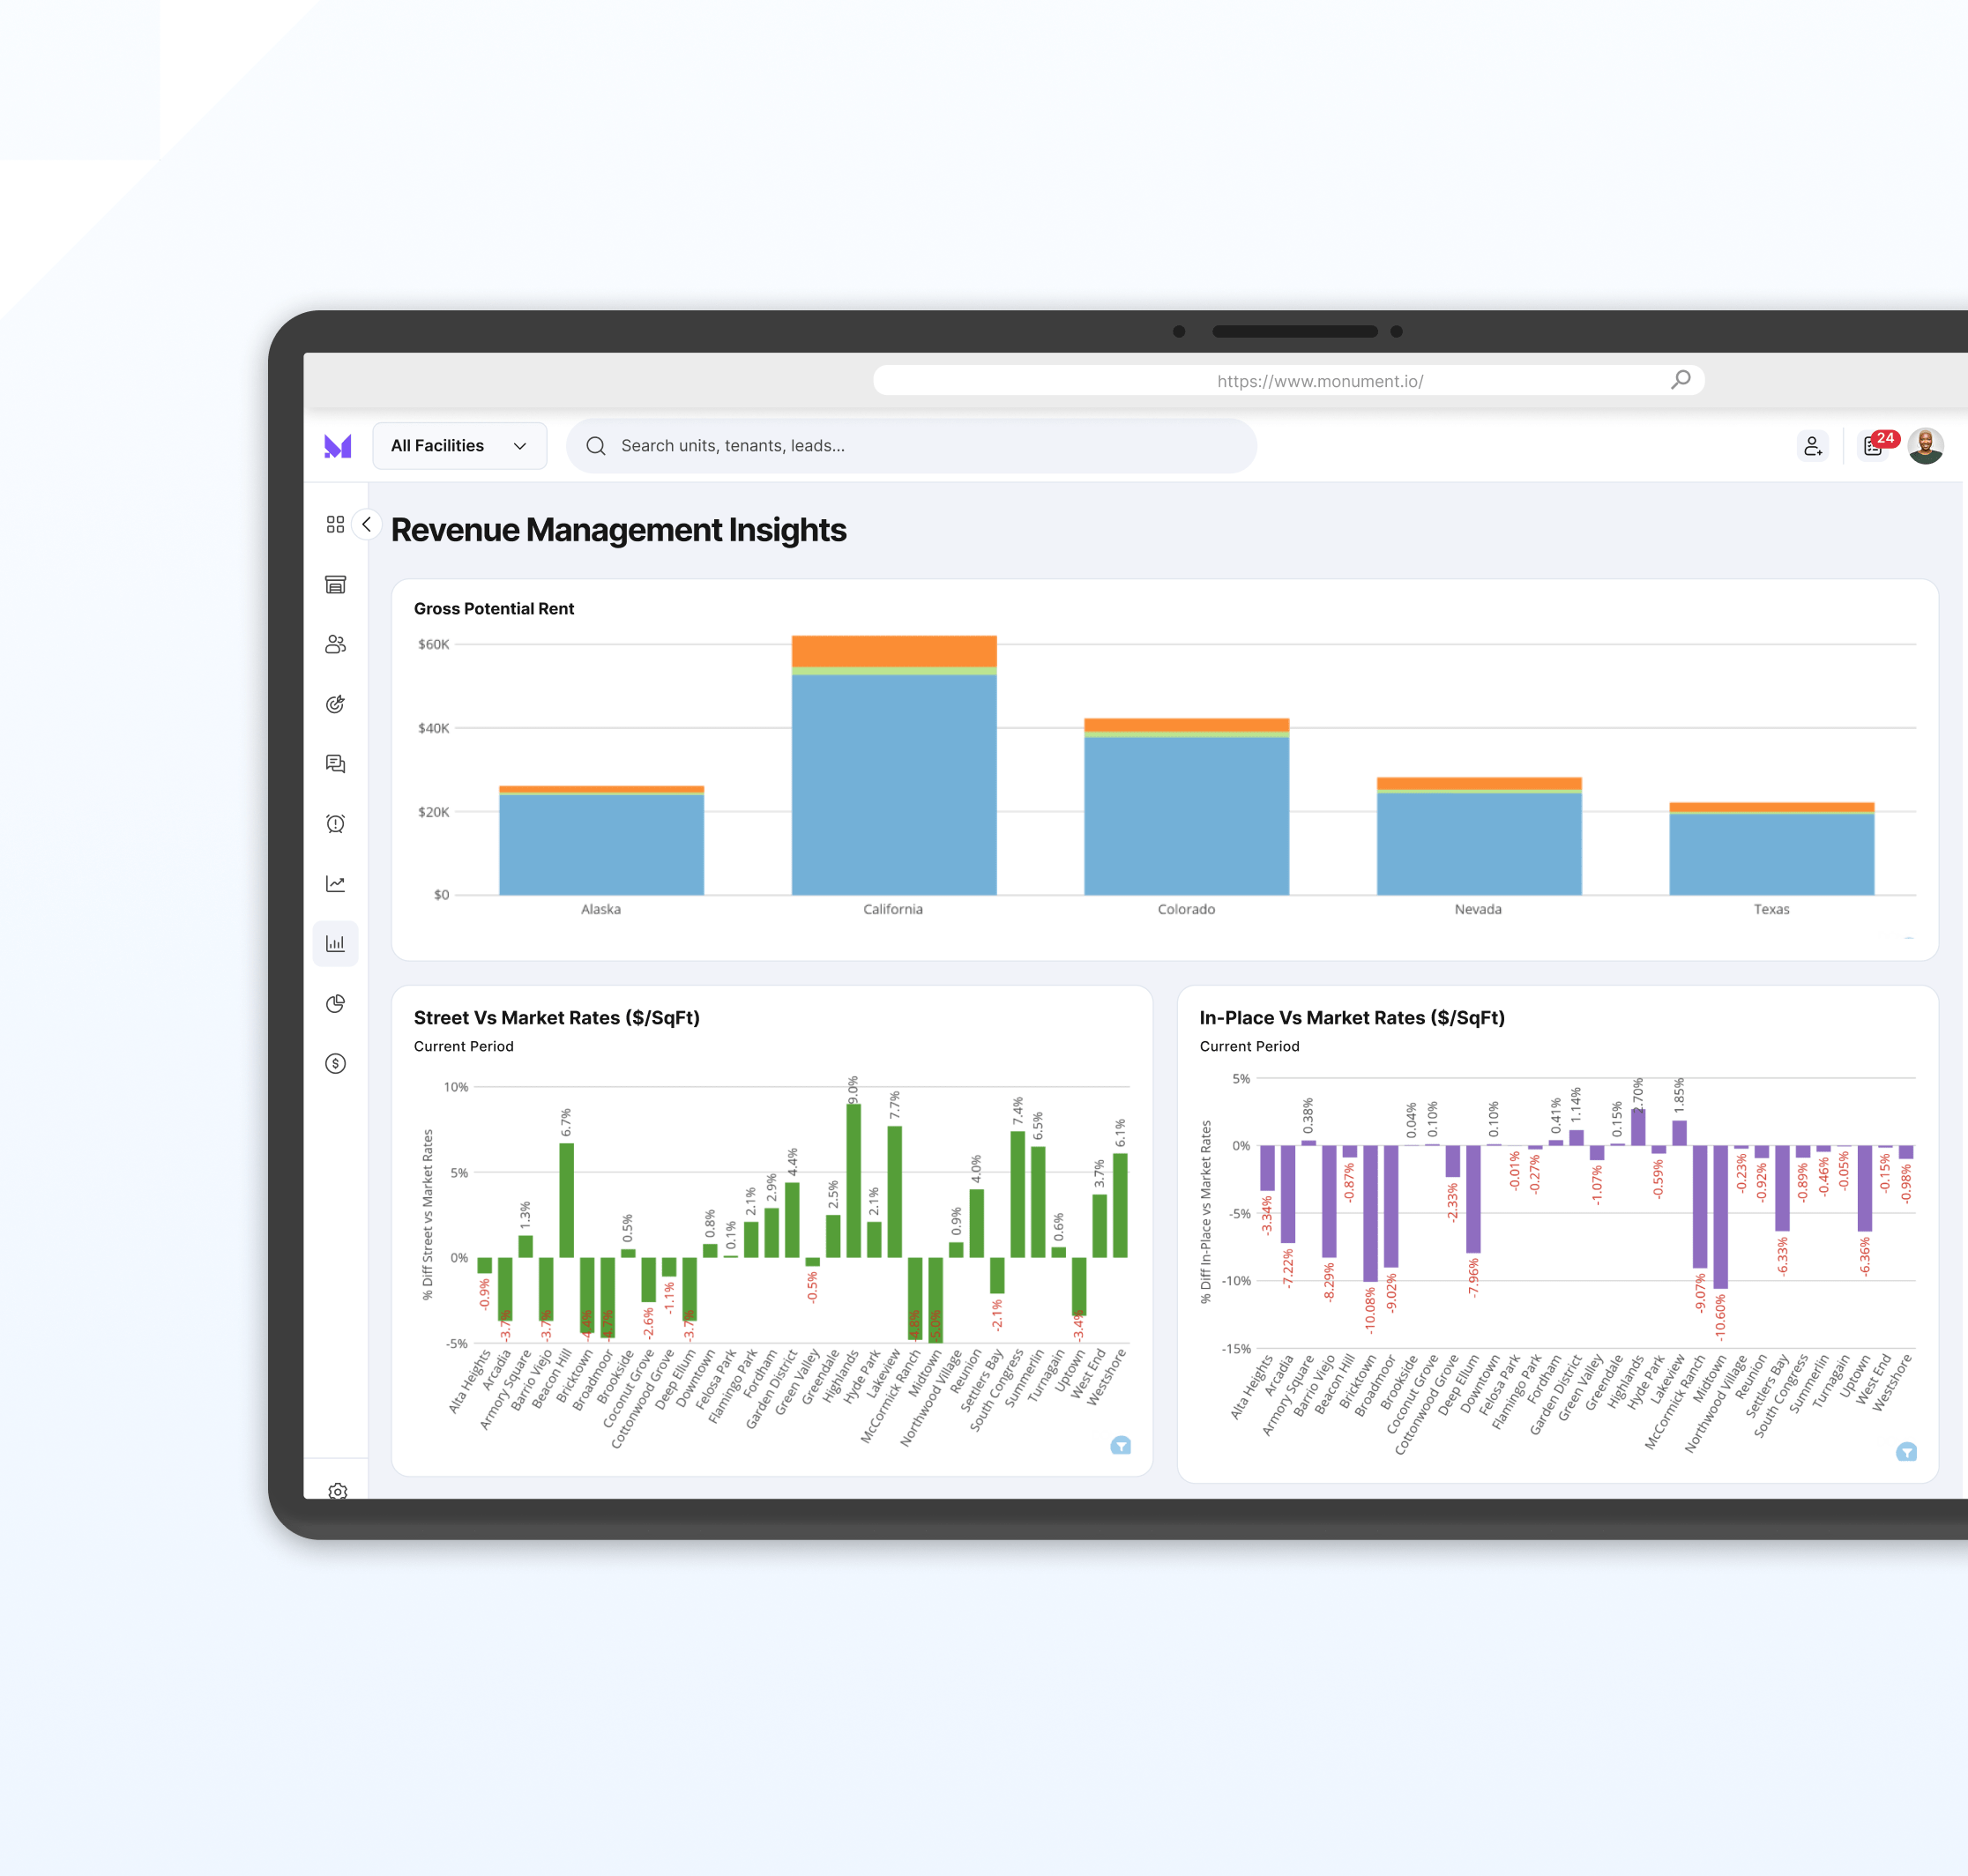
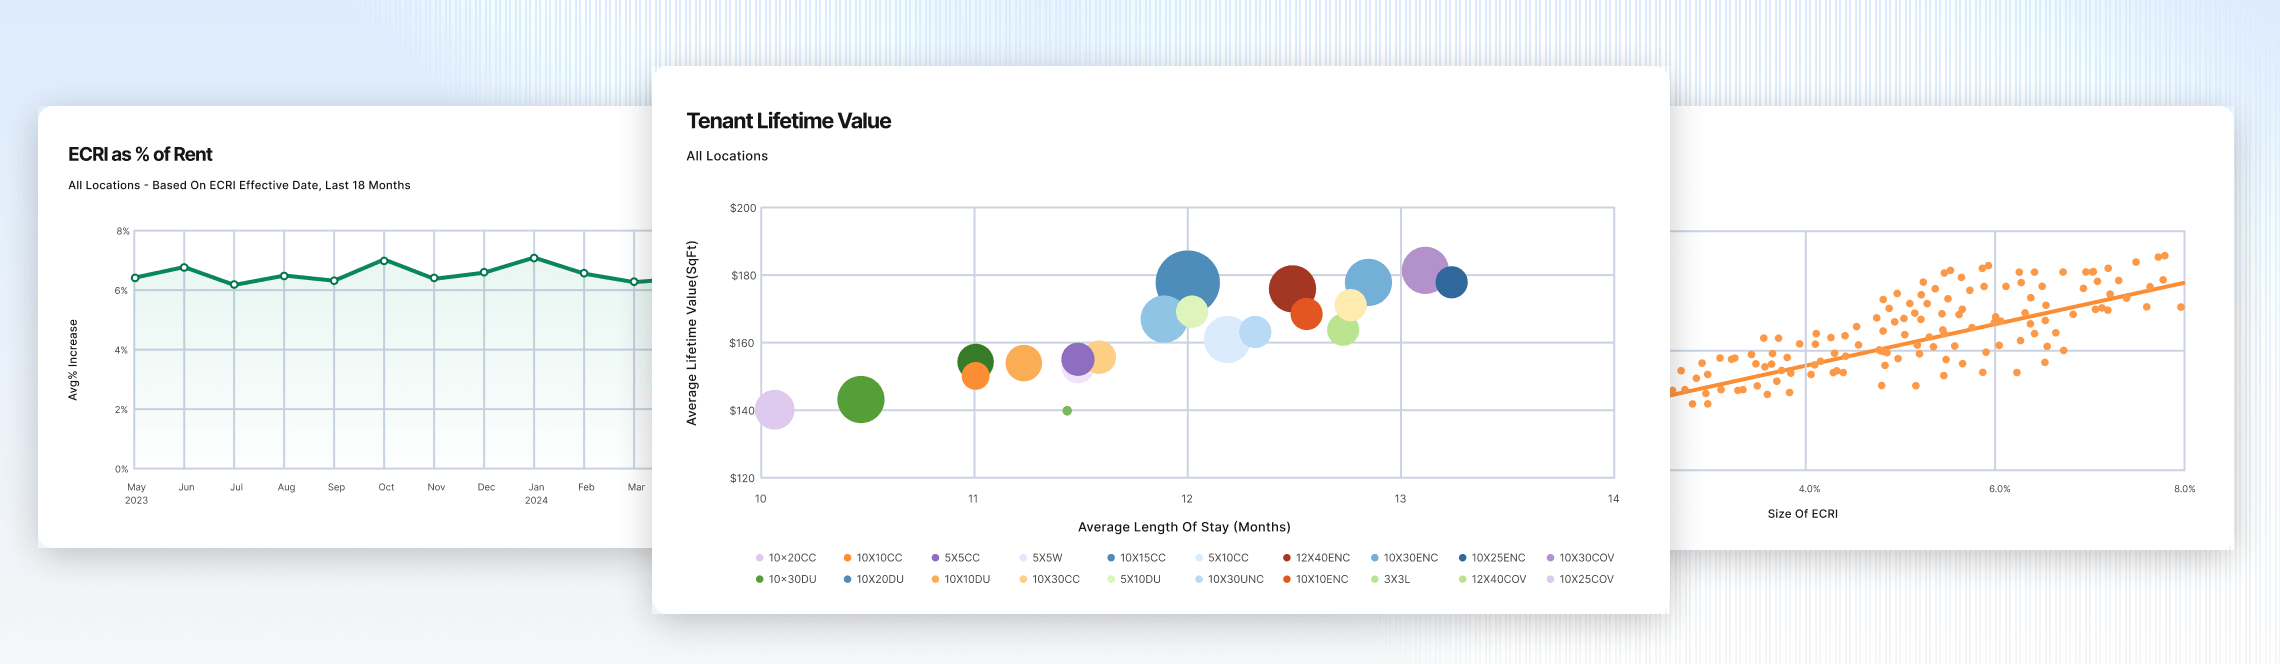
Understand the performance of your rent increases and pricing strategies with Monument’s revenue management insights. Analyze the financial impact of your decisions and adjust strategies to maximize revenue.
Track incremental revenue generated by rent increases in real time.
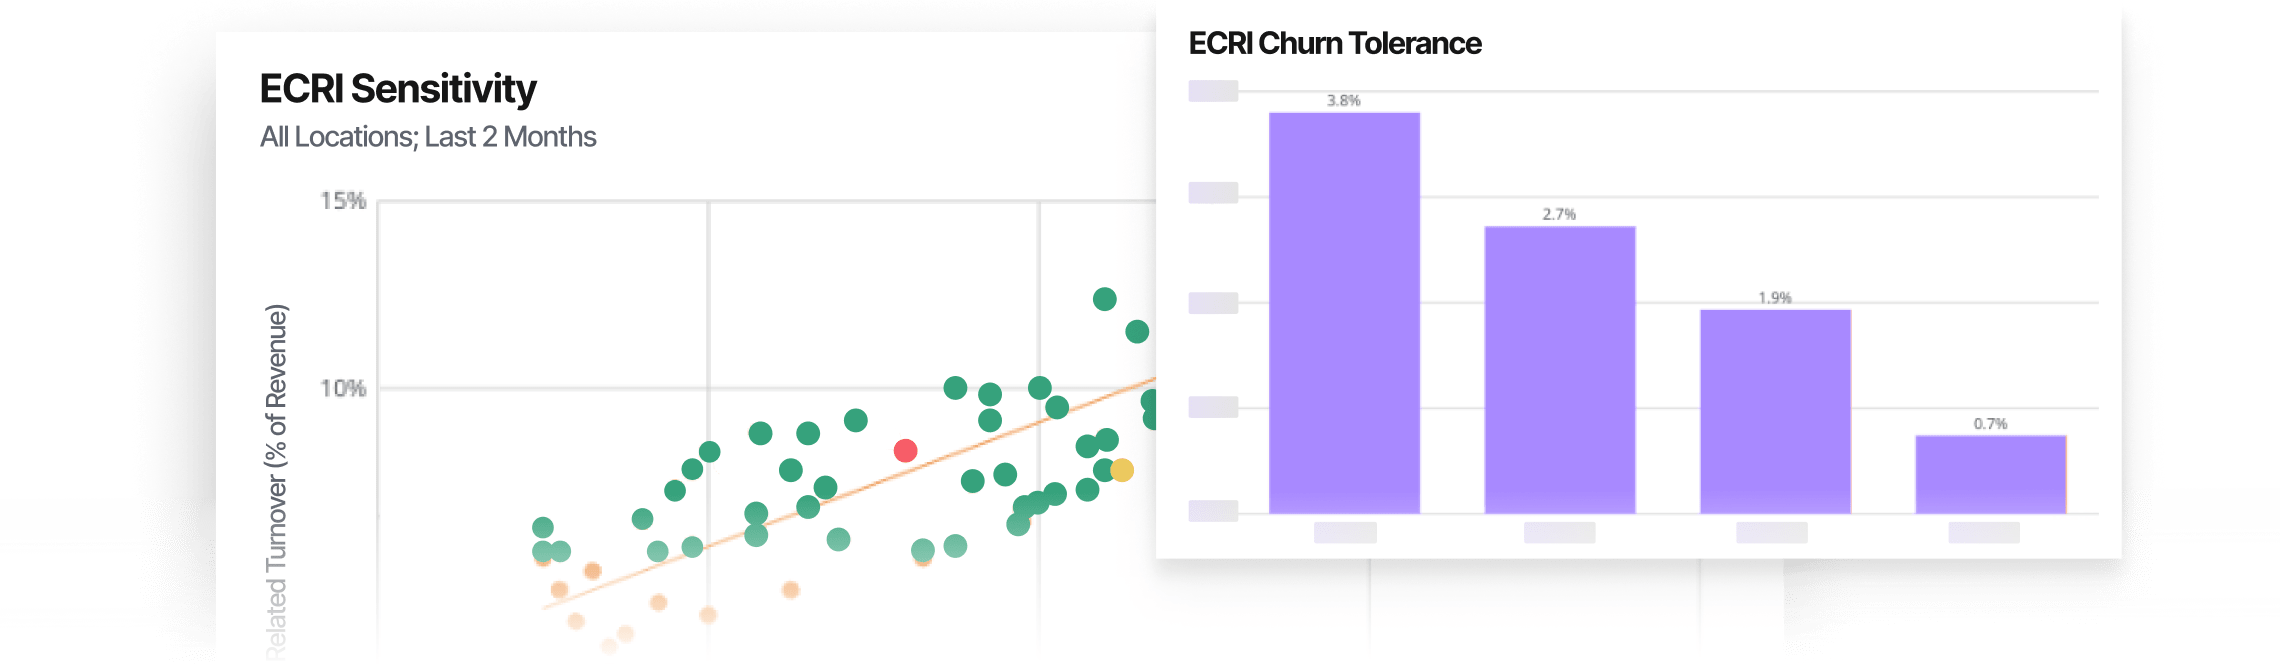
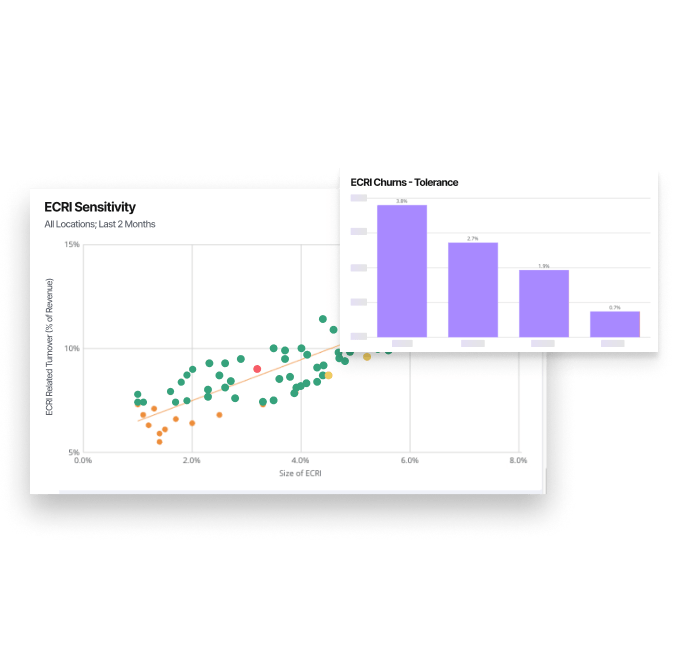
Measure tenant churn and retention for data-driven pricing decisions.
Optimize rent adjustments with granular insights by facility or unit group.
Showcase your portfolio’s performance with tailored reports
Monument’s investor insights provide the financial and operational data you need to build trust and confidence with stakeholders. Deliver clear, concise, and customized reports that highlight portfolio performance.
Create tailored dashboards that focus on key investor metrics.
Showcase revenue growth, occupancy trends, and tenant behavior.
Provide transparency with real-time data that builds credibility.
Marketing insights
that drive growth
Stop guessing and start optimizing. Track lead sources, conversion rates, and campaign performance in real-time. Monument’s Marketing Insights help you optimize spending and drive occupancy with data-backed decisions.
Analyze lead-to-lease conversion rates to improve marketing ROI.
Track campaign performance and identify the most effective channels.
Understand tenant acquisition trends to tailor future campaigns.
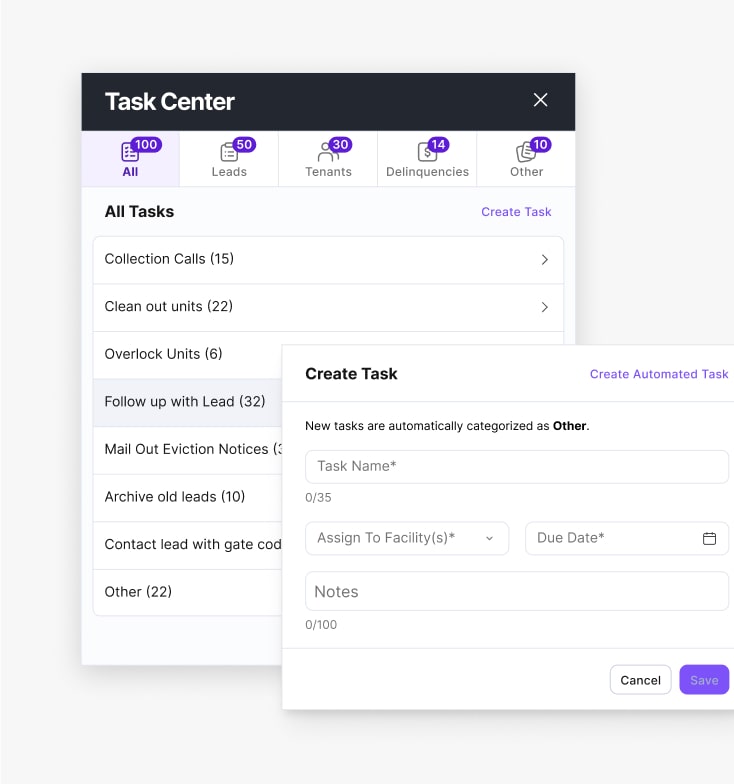
Operational efficiency at a glance
Stay ahead with real-time insights on tenant activity, facility health, and team performance– so you can make data-driven decisions with confidence.
Monitor occupancy, delinquency rates, and overdue payments in one dashboard.
Identify operational bottlenecks and streamline workflows.
Gain visibility into team task completion and facility performance.
Turn data Into
actionable insights with Monument’s BI tools
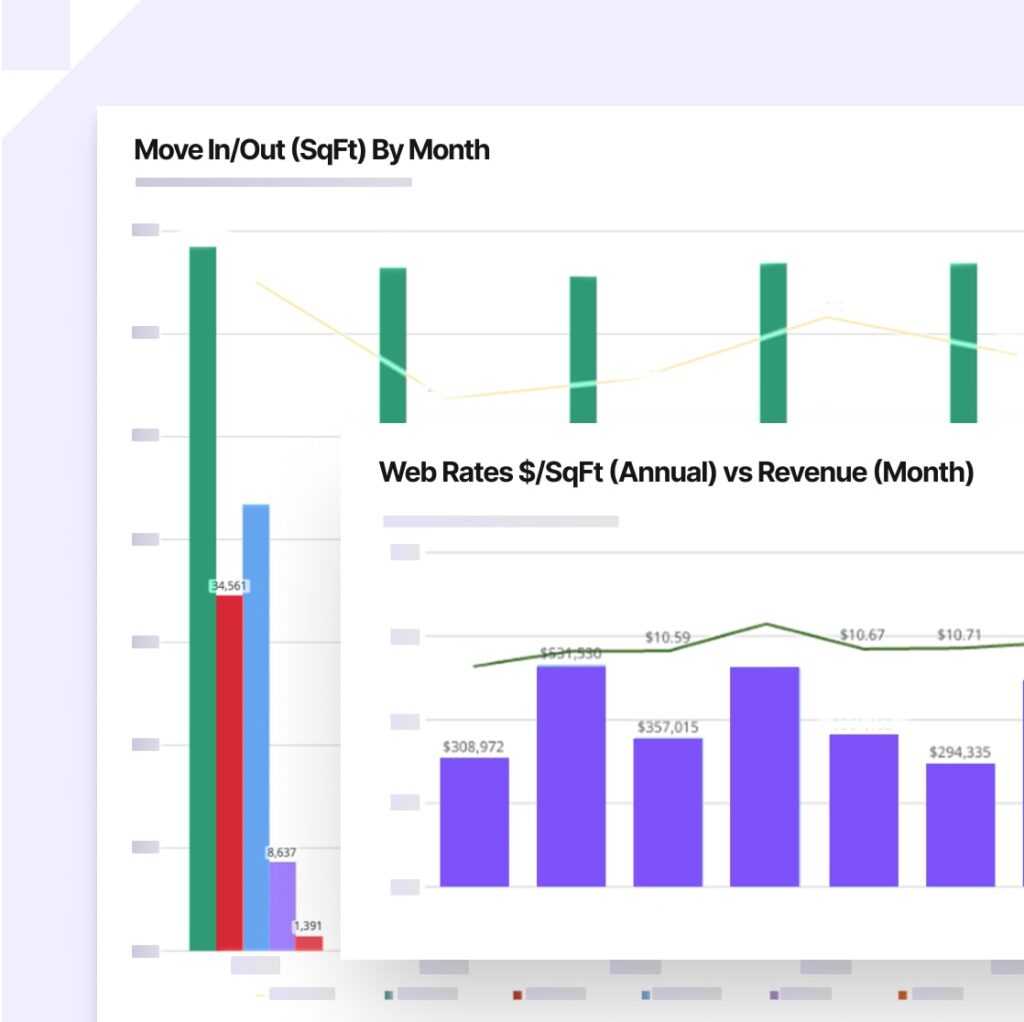
Monument’s Integrated Business Intelligence Platform adds advanced data visualization to your analytics toolkit. Connect your data to interactive dashboards for deeper insights and better decision-making.
Visualize portfolio-wide data with interactive dashboards.
Customize reports and metrics for specific regions, facilities, or unit groups.
Connect to external BI tools like Power BI or Tableau for advanced reporting
integrations
Seamlessly connect with your favorite tools
We play well with others. Monument’s rental website integrates with industry-leading tools to provide a unified experience for tenants and operators.
Easily track performance and focus on what matters most.
Tailored Dashboards for Every Role
Investor, operator, marketing, and revenue dashboards provide the intelligence you need.
Comprehensive Reports Made Simple
Get all the reports you’d expect—plus new, actionable interpretations.
Real-Time Insights
Always know where you stand with real-time data and up-to-date analytics.
Frequently asked questions
Questions? We have answers. Explore our FAQ section to learn more about how Monument works, its features, and how it can support your business. Still curious? Reach out—we’re here to help!
What are the key insights provided by Monument’s platform?
Monument offers tailored dashboards with insights into tenant behavior, revenue trends, occupancy rates, and rent increase performance. These insights help operators make data-driven decisions to optimize their business operations.
Does Monument provide real-time analytics?
Yes, Monument’s insights are generated in real-time, allowing operators to access up-to-date data without manual intervention. This ensures timely and accurate reporting for decision-making.
What types of dashboards are available in the Insights module?
Monument provides a variety of dashboards, such as investor dashboards, marketing dashboards, revenue dashboards, and operator dashboards, each designed to address specific aspects of facility performance and business needs.
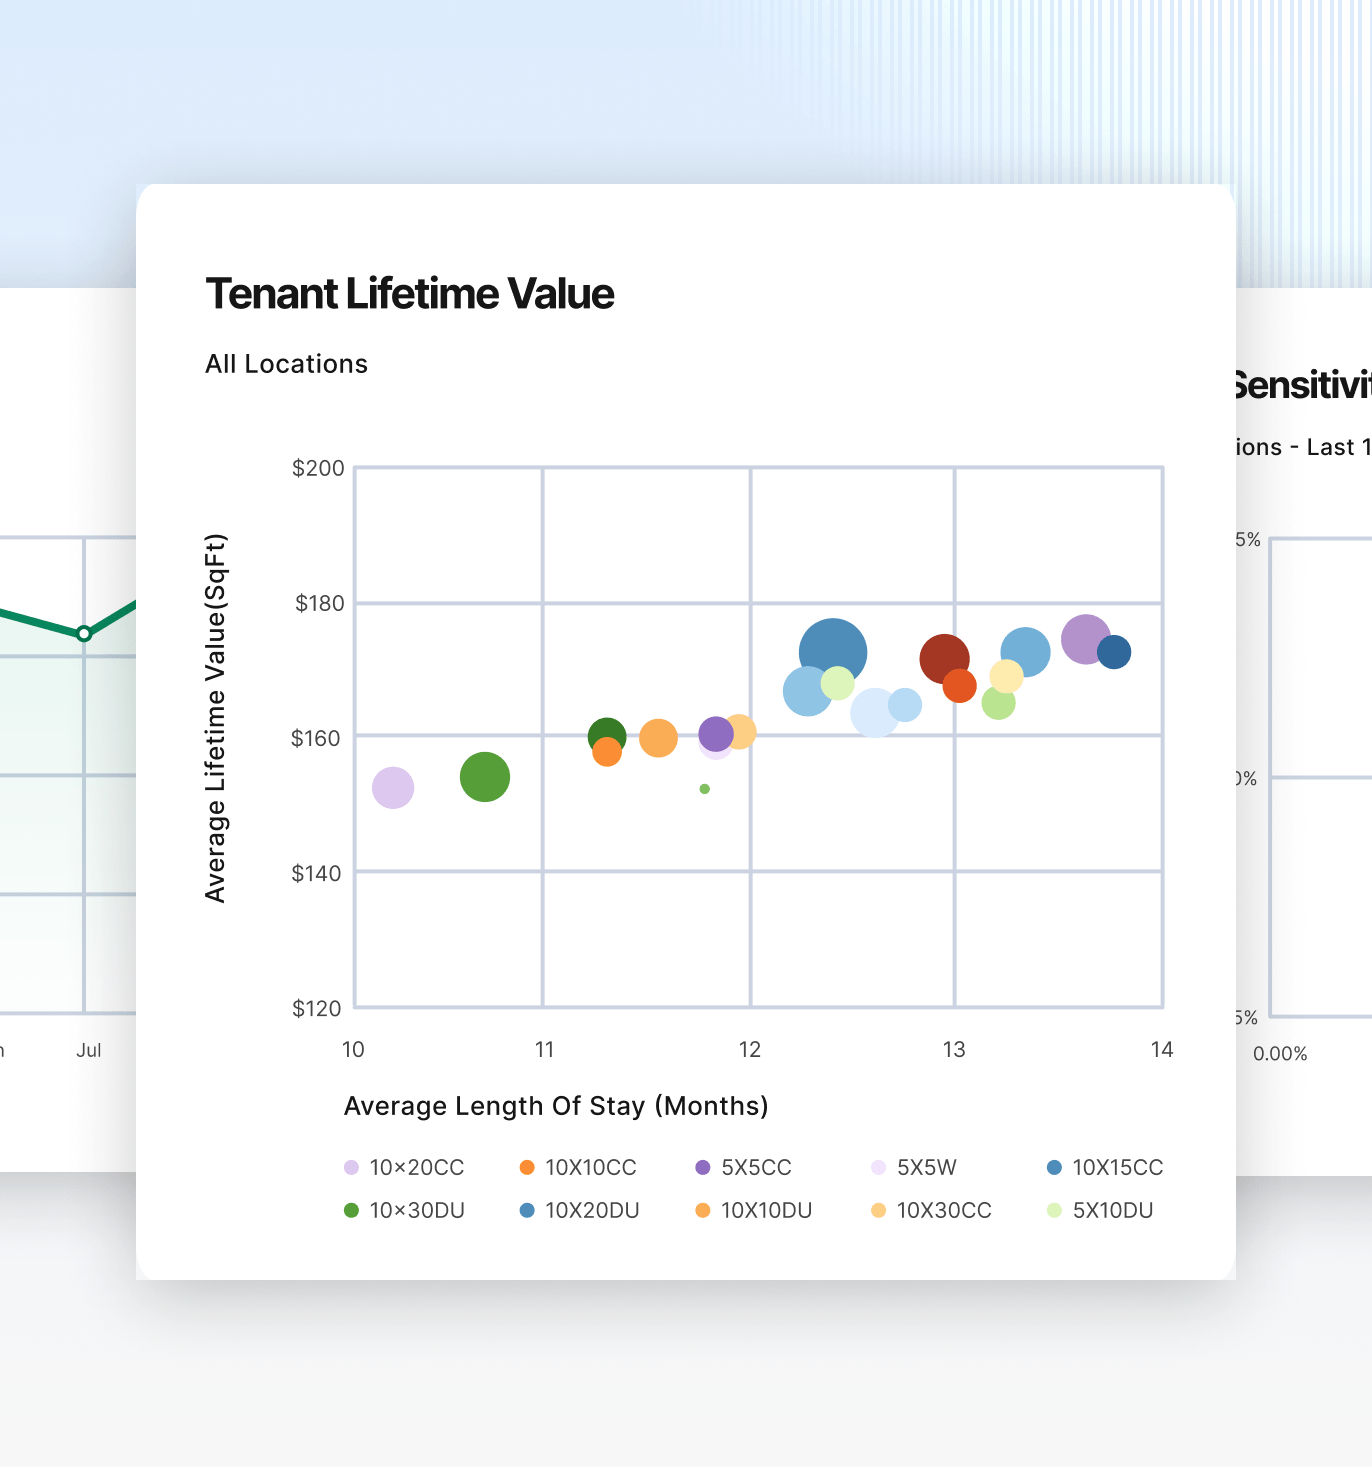
Can operators track the success of rent increases through Monument’s insights?
Absolutely. Monument’s platform provides metrics on incremental revenue retained from rent increases, churn rates, and tenant sensitivity to price changes. This allows operators to evaluate and refine their rent increase strategies.
How customizable are the reports and dashboards?
Monument’s insights module is highly customizable, allowing operators to filter data by location, region, customer segment, or strategy. This flexibility ensures operators can tailor insights to their unique requirements.
Can Monument’s insights help identify trends across multiple facilities?
Yes, Monument’s platform consolidates data from multiple facilities, enabling operators to identify trends, compare performance metrics, and implement effective strategies across their portfolio.
What role does business intelligence play in Monument’s platform?
Monument’s insights are powered by a business intelligence tool, similar to Tableau or Power BI, offering advanced analytics and interactive visualizations to help operators uncover actionable insights.
Are the insights exportable for presentations or collaboration?
Yes, Monument allows operators to export detailed reports and visualizations, making it easy to share insights with stakeholders, investors, or team members.
Discover a smarter way to manage your portfolio and maximize NOI