


Occupancy is the metric every operator watches first. It drives revenue, valuation, and investor conversations before anything else comes up.
Past a few sites, though, occupancy stops being something you can walk out and check. It becomes a data problem, and operators looking to increase self-storage occupancy at scale need a different approach than what works for a single site.
This article covers:
Pricing, marketing, and collections are the usual levers. They work, but not the same way at every scale. A single-site owner can price on instinct because they see the property daily. An operator running twenty or thirty facilities across several states doesn’t have that option. Applying the single-site playbook at portfolio scale is where a lot of occupancy strategies quietly stall.
Key Takeaways
Self-storage revenue gets reported in different ways, and mixing them up leads to bad decisions. Here’s how Monument defines each term before you dig into the numbers.
Total Revenue is everything you bill tenants for space and services. This includes rent for storage units, fees such as admin or late fees, coverage charges like tenant protection or insurance plans, and other billable services.
Think of it as “what we charged,” not “what we collected.” Revenue gets recorded on the invoice date, not when the tenant pays. Every report and dashboard uses this invoice-date view, except for accounting-specific reports.
Included in Total Revenue:
| Category | What It Covers |
| Rent charges | Billed for unit rentals, net of discounts and promotions |
| Tenant Protection | Insurance or protection plan enrollments |
| Services & Fees | Admin fees, late fees, auction fees, and similar charges |
| Other Billable Services | Extended access, cleaning, in-unit monitoring, and similar add-ons |
| Merchandising | Product sales |
Not included: Sales tax. It’s collected on behalf of tax authorities, not counted as income.
Self storage occupancy is the share of your rentable space that’s generating income right now. That sounds simple, but “rentable space” and “generating income” carry a lot of nuance, and operators tend to measure them in three different ways.
This is the most basic measure, units rented divided by total units. It’s easy to calculate and easy to explain, which is why it’s the number most people mean when they say “self-storage occupancy.” Its weakness is that it treats a 5×5 unit the same as a 10×30. A facility can hit 95% unit occupancy while still leaving a lot of square footage, and revenue, unrented.
Formula: Units Rented / Total Units = Unit Ratio
RevPAF is Total Revenue divided by Total Rentable Square Feet. It measures how efficiently you’re using space across your entire unit mix rather than counting how many units are filled. It combines occupancy and rate into one number, so it rewards operators who fill the right units at the right price. Unit ratio tells you how full you are. RevPAF tells you how well you’re monetizing the space you have.
Formula: Total Revenue divided by Total Rentable Square Feet
Economic occupancy compares the rent you actually collect against the gross potential rent your facility could generate if every unit rented at full street rate. It accounts for vacancy, but it also factors in discounts, promotions, and delinquency, all of which quietly erode revenue even when a unit shows as “occupied” on paper.
Formula: (Actual Rent Collected / Gross Potential Rent) x 100 = Economic Occupancy
Economic occupancy matters most to owners and investors because it reflects real revenue rather than filled doors. A facility can look strong on unit ratio while economic occupancy tells a very different story, especially when promotional pricing or uncollected rent is masking the gap underneath. A serious read on self storage occupancy rates has to include all three measures, since each one catches something the others miss.
Self storage average occupancy rate figures vary quite a bit depending on the source and the type of operator being measured. The gap between operator types is one of the more revealing trends in the industry right now, and it holds up across every major tracker, including TractIQ and Matthews Real Estate Investment Services.
That gap isn’t a market accident. REITs tend to run tighter pricing discipline, faster lead response, and more consistent collections across every site they operate, the same operational habits this article covers below. The size of the gap is worth sitting with, because it’s largely process, not access to a different customer.
Regional differences matter here. Sun Belt metros face the sharpest pressure from pandemic-era construction, just as migration into those markets has slowed. Northeast and Midwest markets have held up better, thanks to limited new supply. Yardi Matrix’s Self Storage Market Outlook tracks this split, and it shows up in rents too. Markets with tighter pipelines post stronger rate growth, while markets absorbing heavy new supply see rates fall, according to RentCafe’s monthly self storage report.
Occupancy also swings seasonally, peaking in summer and softening in winter. That means a single facility’s occupancy rate means little without a regional and seasonal benchmark for comparison. Operators working to increase self-storage occupancy need to weigh both factors before drawing conclusions from their numbers.
Nationally, the construction pipeline is easing as developers pull back, giving oversupplied markets room to recover. Tenant behavior has shifted too. Slower home sales and a multi-year low in state-to-state migration mean fewer move-outs, and Matthews reports tenants are staying longer than the historical norm, cushioning national occupancy even as new supply pressures individual markets.
The gap between physical occupancy and economic occupancy has widened as well. National street rates have run roughly flat to down over the past year (outlined in RentCafe’s report above), and operators have leaned more heavily on move-in promotions like a free first month or steep discounts on the first few months to keep units full while rates soften. Research (specifically Storable’s—linked in Matthew’s research above) also shows just how aggressive those concessions have gotten in the most competitive Sun Belt submarkets.
That approach protects the unit ratio number while quietly compressing economic occupancy underneath it. An operator watching only physical occupancy can miss a real revenue decline entirely, which is why owners and investors weigh economic occupancy so heavily when they evaluate a portfolio’s actual performance.
| Segment / Market Area | Occupancy Trend | Rate Trend | Supply Pipeline | Source |
| REIT-operated portfolios | Consistently the highest occupancy nationally | Softening year over year, in line with the broader market | Near the national average | TractIQ, Yardi Matrix |
| Non-designated / independent operators | Middle of the pack, above sophisticated private operators | Varies widely by region | Varies widely by region | TractIQ |
| Sophisticated private operators | Trails both REITs and independent operators | Varies widely by region | Varies widely by region | TractIQ |
| “Healthy” stabilized target (any operator type) | The benchmark most operators aim for | N/A | Balanced, neither over- nor undersupplied | Common lender and appraisal standard |
| Supply-constrained metros (e.g., Boston) | Strong, outperforming | Some of the steadiest rate gains nationally | Well below the national average | Yardi Matrix |
| High-demand growth markets (e.g., Santa Clarita, Lincoln) | Strong, outperforming | Among the strongest rate gains nationally | Low, though rising in some markets as builders respond to demand | RentCafe, Yardi Matrix |
| Oversupplied metros (e.g., Glendale, Cape Coral) | Softening under supply pressure | Among the steepest rate declines nationally | Well above the national average | RentCafe, Yardi Matrix |

The market and regional pressures above (overbuilt supply pipelines, a frozen housing market, softening street rates) touch every operator. But the performance gap between national REITs and independent portfolios shows that market conditions only explain part of the picture.
Low occupancy is rarely just a market problem. More often it’s a sign that typical operational processes haven’t kept pace with the market. The causes of low occupancy in self storage generally fall into two buckets. Some you can spot by walking a single site. Others only surface once you’re managing more than one. Both cost real revenue, but they call for different fixes.
This kind of operational friction helps explain why the independent and private operator model tends to struggle as facility counts grow. The local, gut-feel tactics that keep a single, family-owned facility running well don’t hold up once you’re managing a portfolio. Closing the gap with REIT-level performance takes a repeatable, data-driven process wrapped around these daily tasks, not more effort from any one manager.
At one or two sites, tracking occupancy is straightforward. A manager walks the property, checks a spreadsheet, and has a clear answer within minutes. This works because the owner has direct, daily visibility into what’s happening on the ground. Pricing decisions, lead follow-up, and collections all happen close enough to the source that problems get caught early, often before they’d show up in any report at all.
Once a portfolio grows past a handful of sites, that same manual approach breaks down. Regional managers end up logging into separate systems per facility, or worse, per region, just to piece together a partial picture. Compiling a portfolio-wide occupancy report turns into a multi-hour exercise in exporting spreadsheets and reconciling formats, and by the time it’s done, the data is already a week old.
That delay is one of the most common self-storage investors’ occupancy data challenges at this stage of growth. Investors and lenders ask for occupancy trends the spreadsheet model can’t produce quickly or accurately. A quarterly investor update that should take an hour to prepare instead takes days, and the numbers still carry more manual error than anyone wants to admit.
The deeper issue isn’t the extra hours, it’s the gap between knowing what happened and knowing why. A spreadsheet can tell you a facility’s occupancy dropped eight points last quarter. It can’t easily tell you whether that drop came from pricing, a marketing lapse, a competitor’s new supply, or a collections backlog. By the time someone digs in manually, the answer usually arrives too late to act on.
This is the point where operators start looking at self-storage occupancy data platforms built for expansion rather than a single site. Moving occupancy data off scattered spreadsheets and separate logins and into one platform changes the speed of the whole operation. A regional manager gets a faster answer on which facilities, unit types, or regions are underperforming, and can drill into the cause right away instead of waiting for the next reporting cycle.
That speed compounds over time. A pricing problem caught in a day instead of a month costs a fraction as much to fix. A facility falling behind on lead follow-up shows up as an early trend line rather than a surprise buried in next month’s report.
| Factor | Spreadsheet-Based Tracking | Platform-Based Tracking |
|---|---|---|
| Time to compile a portfolio-wide report | Hours to days, depending on facility count | Minutes, updated in real time |
| Data freshness | Often a week or more out of date by the time it’s reviewed | Current as of the last transaction |
| Root-cause visibility | Requires manual digging across separate exports | Drill-down from portfolio to facility to unit in the same view |
| Consistency across facilities | Depends on each site’s manager keeping their own records | Same data structure and definitions at every site |
| Investor and lender reporting | Manual reformatting for each request | Standing reports ready on demand |
Before scale becomes the issue, it’s worth getting the fundamentals right. These practical, facility-level tactics apply regardless of how many locations you run, and they’re the foundation everything else builds on.
Pricing is rarely a single number. Most operators run a street rate and a web rate side by side, using a lower, promoted web rate to win the online search while protecting the higher street rate for walk-ins and renewals. The gap between the two should reflect real demand differences, not guesswork. In highly competitive or overbuilt markets, the spread between a web rate and a street rate can widen dramatically, sometimes with web rates discounted 30% to 55% lower than the street rate.
When occupancy runs soft on a specific unit type, resist the instinct to cut prices across the board. Test targeted discounts on the slow-moving unit types only, whether that’s oversized units, drive-up units, or a particular climate-controlled size. Blanket price cuts protect occupancy on units that were never at risk while giving away margin you didn’t need to give up. The aim is to optimize self storage occupancy rates without sacrificing the rate integrity you’ve built on units that are already performing well.
A rental website’s real job is to convert visits into leases, beyond simply looking professional. That means clear pricing, a simple checkout, and a path that doesn’t require a phone call to complete a rental. Every extra step between “interested” and “signed” gives a prospect a chance to abandon the process.
Abandoned rentals deserve the same urgency as a live lead. A prospect who started checkout but didn’t finish is closer to signing than someone who just landed on the page. Following up before that lead goes cold, ideally within minutes, recovers rentals that would otherwise be lost entirely. Treating abandoned carts as a dead end rather than a warm lead leaves some of the easiest occupancy gains on the table. Automated follow-up for leads based on specific actions, such as an abandoned cart, can be configured in Monument.
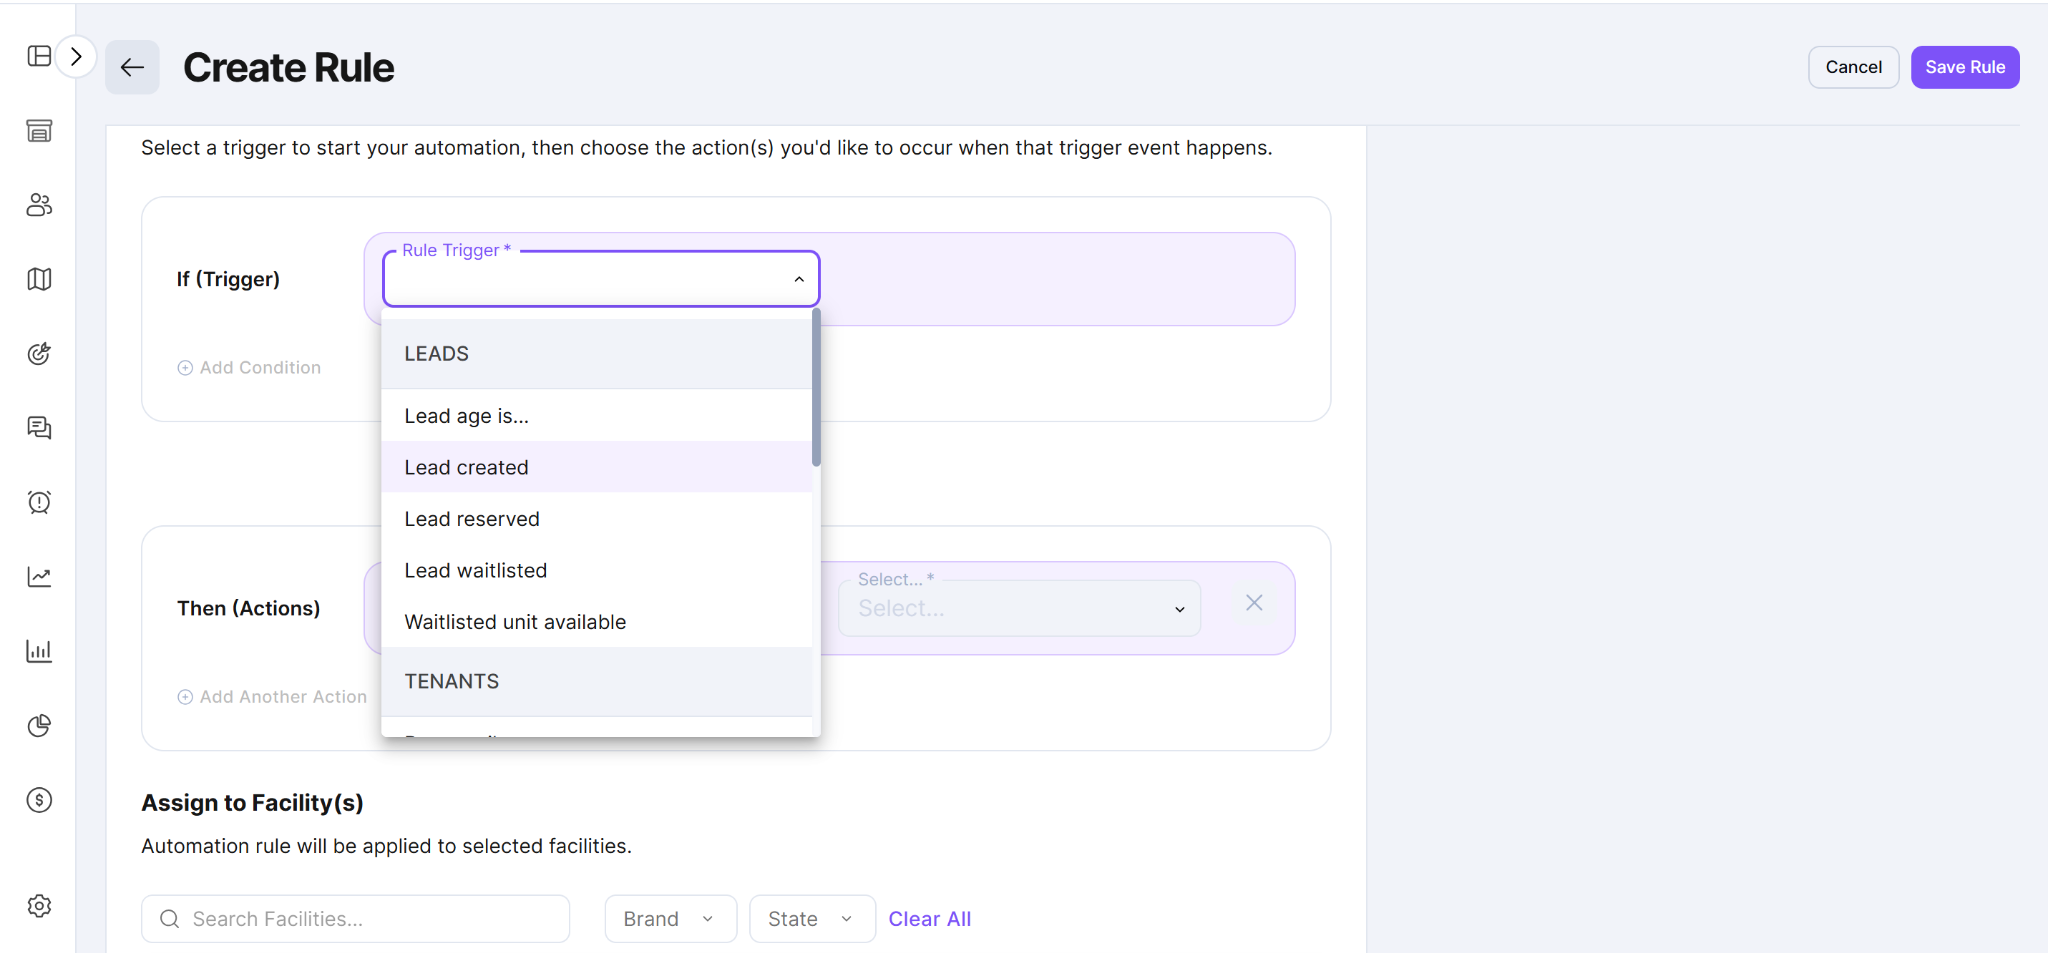
A screenshot showing Monument’s lead automation rules.


Occupancy depends as much on keeping the units you already have as it does on filling empty ones. Faster collections reduce involuntary vacancies, since tenants who fall behind and eventually default represent lost occupancy just as much as an empty unit does. Consistent notice timelines, applied the same way every time, protect occupied units from unnecessary turnover and keep the process fair and predictable for tenants and staff alike. These can be automated and configured easily in Monument:
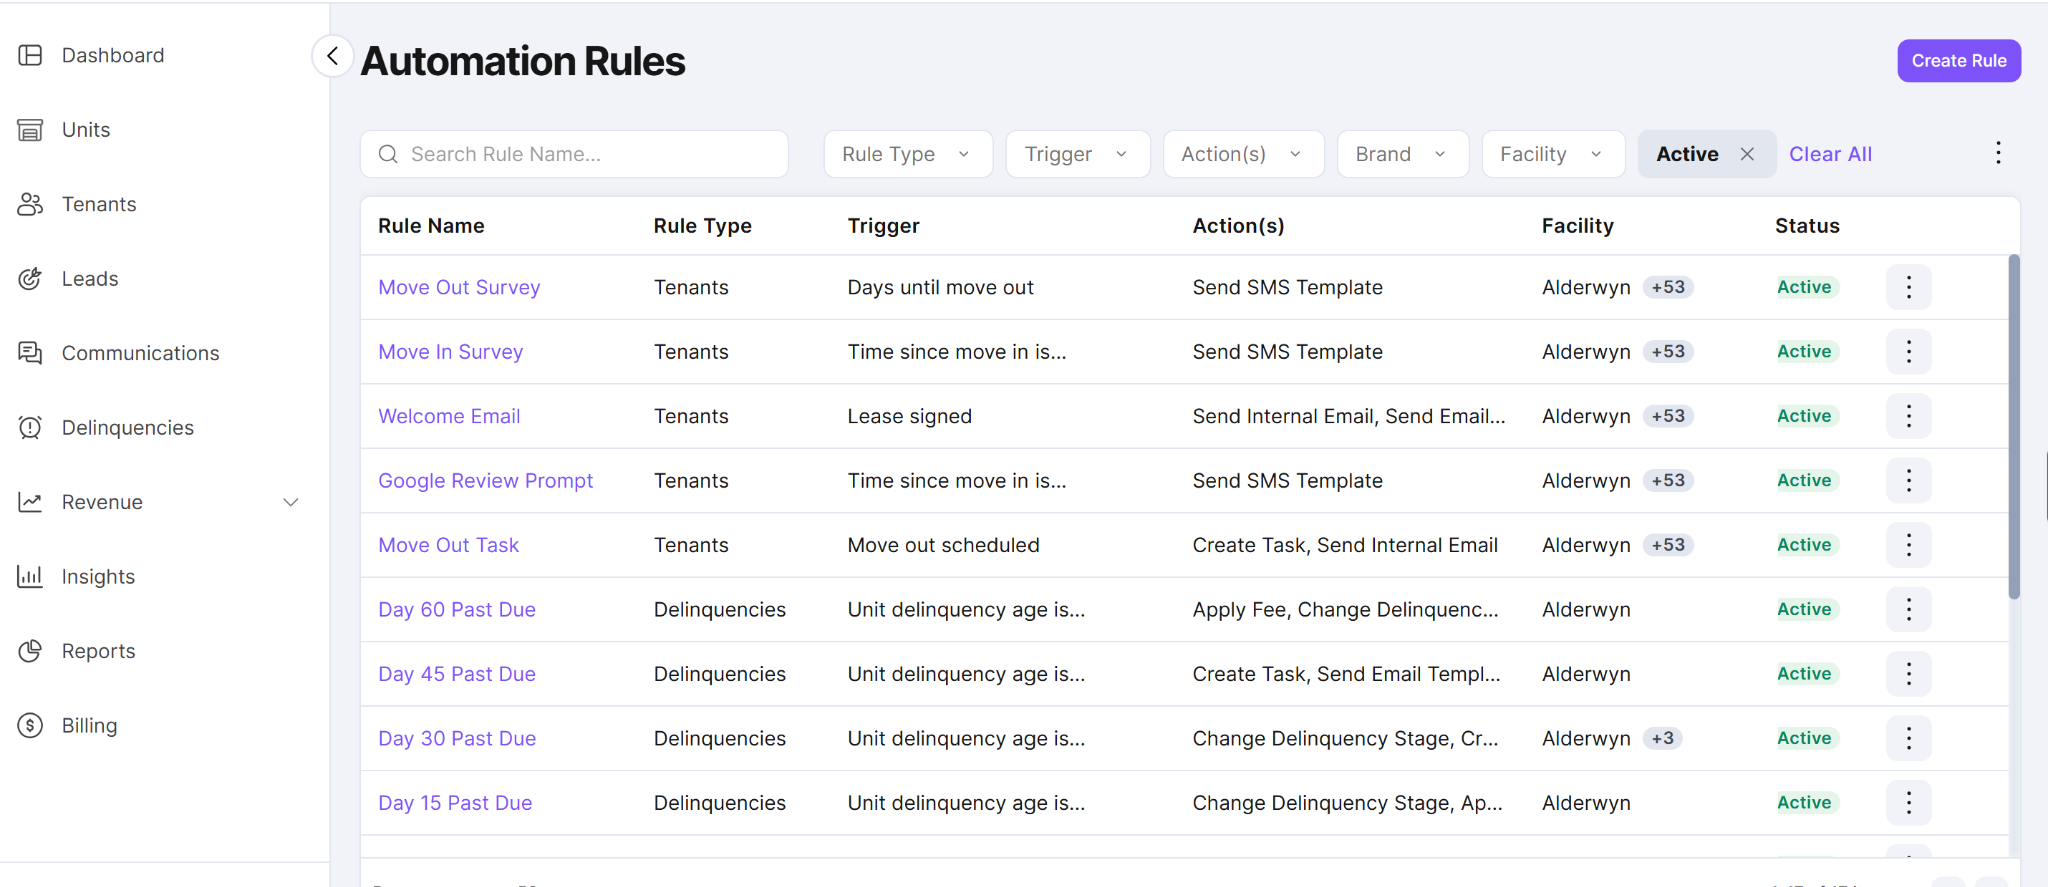
An example of Monument’s delinquency automations.
A tenant who’s ten days late and gets a same-day reminder is far more likely to catch up than one who doesn’t hear anything until the invoice is sixty days overdue. That gap between an occupied unit that’s paying on time and one that’s quietly heading toward default is where a meaningful share of preventable vacancy actually starts.

The tactics above work at any scale. What changes as facility count grows isn’t the list of tactics. It’s whether they get applied the same way, every time, at every site.
The biggest driver of occupancy gains at scale is consistency, not a new tactic. Same pricing logic (though rates will vary across facilities), same follow-up timing, same delinquency rules at every site, regardless of who’s managing it that week. When one facility follows up on leads in ten minutes and another takes a day, the portfolio’s average occupancy is being dragged down by inconsistency rather than market conditions.
A talented regional manager can push one facility’s numbers up through sheer attention, but that approach doesn’t scale across twenty or fifty sites. A standardized process does, because it removes the dependency on any single person remembering to do the right thing at the right time, at every location, every day.
Standardizing a process is one thing. Dedicated tracking is what ensures that it’s actually working at every site. At a portfolio level, the useful unit of analysis is occupancy by facility, by unit type, and by region, viewed side by side. Self storage software occupancy analysis tools built for this purpose replace the manual reporting cycle with real-time visibility, so a regional manager can spot which sites, unit sizes, or markets are drifting before the trend shows up in a monthly report.
Real-time visibility tells you what’s happening now. Forecasting tells you what’s coming next, and reacting to a seasonal dip after it hits is expensive. Self storage occupancy forecasting software uses historical trends, by facility and by unit type, to anticipate those dips before they happen. REIT-level operators use forecasting to plan promotions and pricing ahead of demand shifts rather than reacting once occupancy has already slipped. That’s the practical difference between managing occupancy and managing around it.
Not every platform marketed as occupancy software is built for portfolio-scale operations. A practical checklist for evaluating the best self storage software for occupancy analysis includes:
Occupancy and pricing are two sides of the same problem, so your software should treat them that way. Look for automated ECRI (Existing Customer Rent Increases) tied to occupancy thresholds at each facility, not a flat schedule applied portfolio-wide. This is a key functionality that Monument provides. When pricing responds to real-time conditions at each site, rent increases reflect actual demand instead of a manual review that only happens once a quarter. That gap between quarterly reviews is where operators lose the most revenue, since a facility that hits 95 percent occupancy in week two won’t see a rate adjustment until the next scheduled cycle.
| Capability | Basic Tracking | Portfolio-Scale Analytics |
| Portfolio view | Facility-by-facility, one login at a time | Single dashboard across every facility |
| Grouping and filtering | Limited or none | Group by region, size, brand, or strategy |
| Rent increase and pricing tools | Manual, applied site by site | Automated, tied to occupancy thresholds |
| Reporting cadence | Monthly, manually compiled | Real time, available on demand |
| Investor and lender reporting | Built from scratch each time | Standing reports ready to share |
| Forecasting | Historical lookback only | Anticipates seasonal and demand shifts |
Monument was built to give the most thorough data to increase self-storage occupancy. Navigator lets operators group facilities along any dimension that matters, whether that’s lease-up versus stabilized assets, region, unit mix, or brand, then report on, analyze, or act on that group all at once. Instead of logging into separate systems per site, a regional manager gets one dashboard that answers which facilities are underperforming, and why, without waiting on a manual report.
Insights builds on that with over 100 purpose-built reports that surface occupancy, revenue, and delinquency trends in real time instead of waiting for month-end. Automation Rules apply the same pricing, follow-up, and delinquency logic across every facility in a group at once, so consistency doesn’t depend on which manager happens to be on shift that week. Together, they address the fragmented data, inconsistent processes, and slow manual reporting covered earlier in this article.
Occupancy starts as a pricing and marketing question at the facility level, but it becomes a data and process question the moment a portfolio grows past a handful of sites. The operators who keep improving occupancy as they scale are the ones who standardize their processes and get a real-time, portfolio-wide view of what’s happening, rather than relying on manual reports that are outdated by the time they’re finished.


Explore top self-storage software solutions with key features, comparisons, and tools for facility operations, marketing,...

Explore top facility management software systems for self-storage, including key features, benefits, and how these...

Discover how 3rd party self storage management improves operations, revenue, and NOI—and what to look...