


Third-party self-storage managers often face a continuous challenge: too many systems, logins, and not quite enough visibility into each of your facilities to run your portfolio the way you know it should be.
You have one of the most demanding roles in the industry, and the accountability for execution, numbers, and growth runs deep. The managers who do well in their roles don’t have a secret method that they’re keeping from everyone else, they just have the visibility they need. That visibility is enabled by having the right tool at their fingertips that gives them a bird’s eye view of all their facilities, all at once.
That’s exactly why Monument built the 3PM Dashboard. It’s a purpose-built analytics command center designed from the ground up for multi-brand, multi-property third-party managers. It’s not an operations screen or a report you pull once a week. It’s a real-time, portfolio-wide view of every metric that drives your business that you can view whenever you need to.
In this article, we’ll walk through the KPIs that matter most, why they matter at the executive level, and how a centralized dashboard changes the way you manage, communicate, and grow.
Key Takeaway: Third-party managers who operate with real-time, portfolio-wide KPI visibility make faster decisions, catch problems earlier, and demonstrate more credible value to property owners without adding to your existing staff.
Most facility management software was designed for single-brand, owner-operated portfolios. The dashboards that ship with these systems are built to help a site manager track what’s happening at one location, not to help a CEO track what’s happening across 40.
As a third-party manager, these systems often don’t cut it. You need a third-party self-storage management solution that:
The gap between what third-party managers need and what legacy systems provide is exactly where Monument’s 3PM Dashboard was built to live.
After working closely with some of the industry’s top third-party operators, we identified the metrics that matter most at the executive level. Here’s every KPI on the Monument 3PM Dashboard and why it earns its place.
The foundational metrics of any self-storage portfolio are the physical and economic capacity. The key to using these metrics is seeing both side by side—not just physical units rented, but the economic occupancy that reflects actual revenue production. A property can be 92% physically occupied and still underperform economically if it’s carrying too many concessions, write-offs, or delinquent balances.
Monument surfaces both metrics simultaneously, with configurable targets per property. An 85% physical occupancy rate is considered stabilized, and 90% is better; however, an occupancy rate well above 90% or near 100% signals a property needs immediate intervention, such as raising rental rates or adding new units.

RevPAF is the CEO-level metric. Instead of focusing on just what you’re charging, it tells you what you’re actually yielding per square foot of rentable space. This information is broken out by unit type, such as climate-controlled, non-climate-controlled, and parking. If you’re averaging $1.25 per square foot on climate but $0.90 on non-climate, that’s a pricing conversation. If one property is at $1.10 while a comparable market is at $1.40, that’s a strategy conversation.
For third-party managers, this metric also closes the loop with property owners. When you can show revenue per available square foot trending up quarter over quarter, you’re demonstrating the value of your management.
Most systems will show you a delinquency rate, but Monument shows you the entire lifecycle from the first day a tenant falls behind all the way through lien processing and auction eligibility, broken out by both unit count and dollar value.
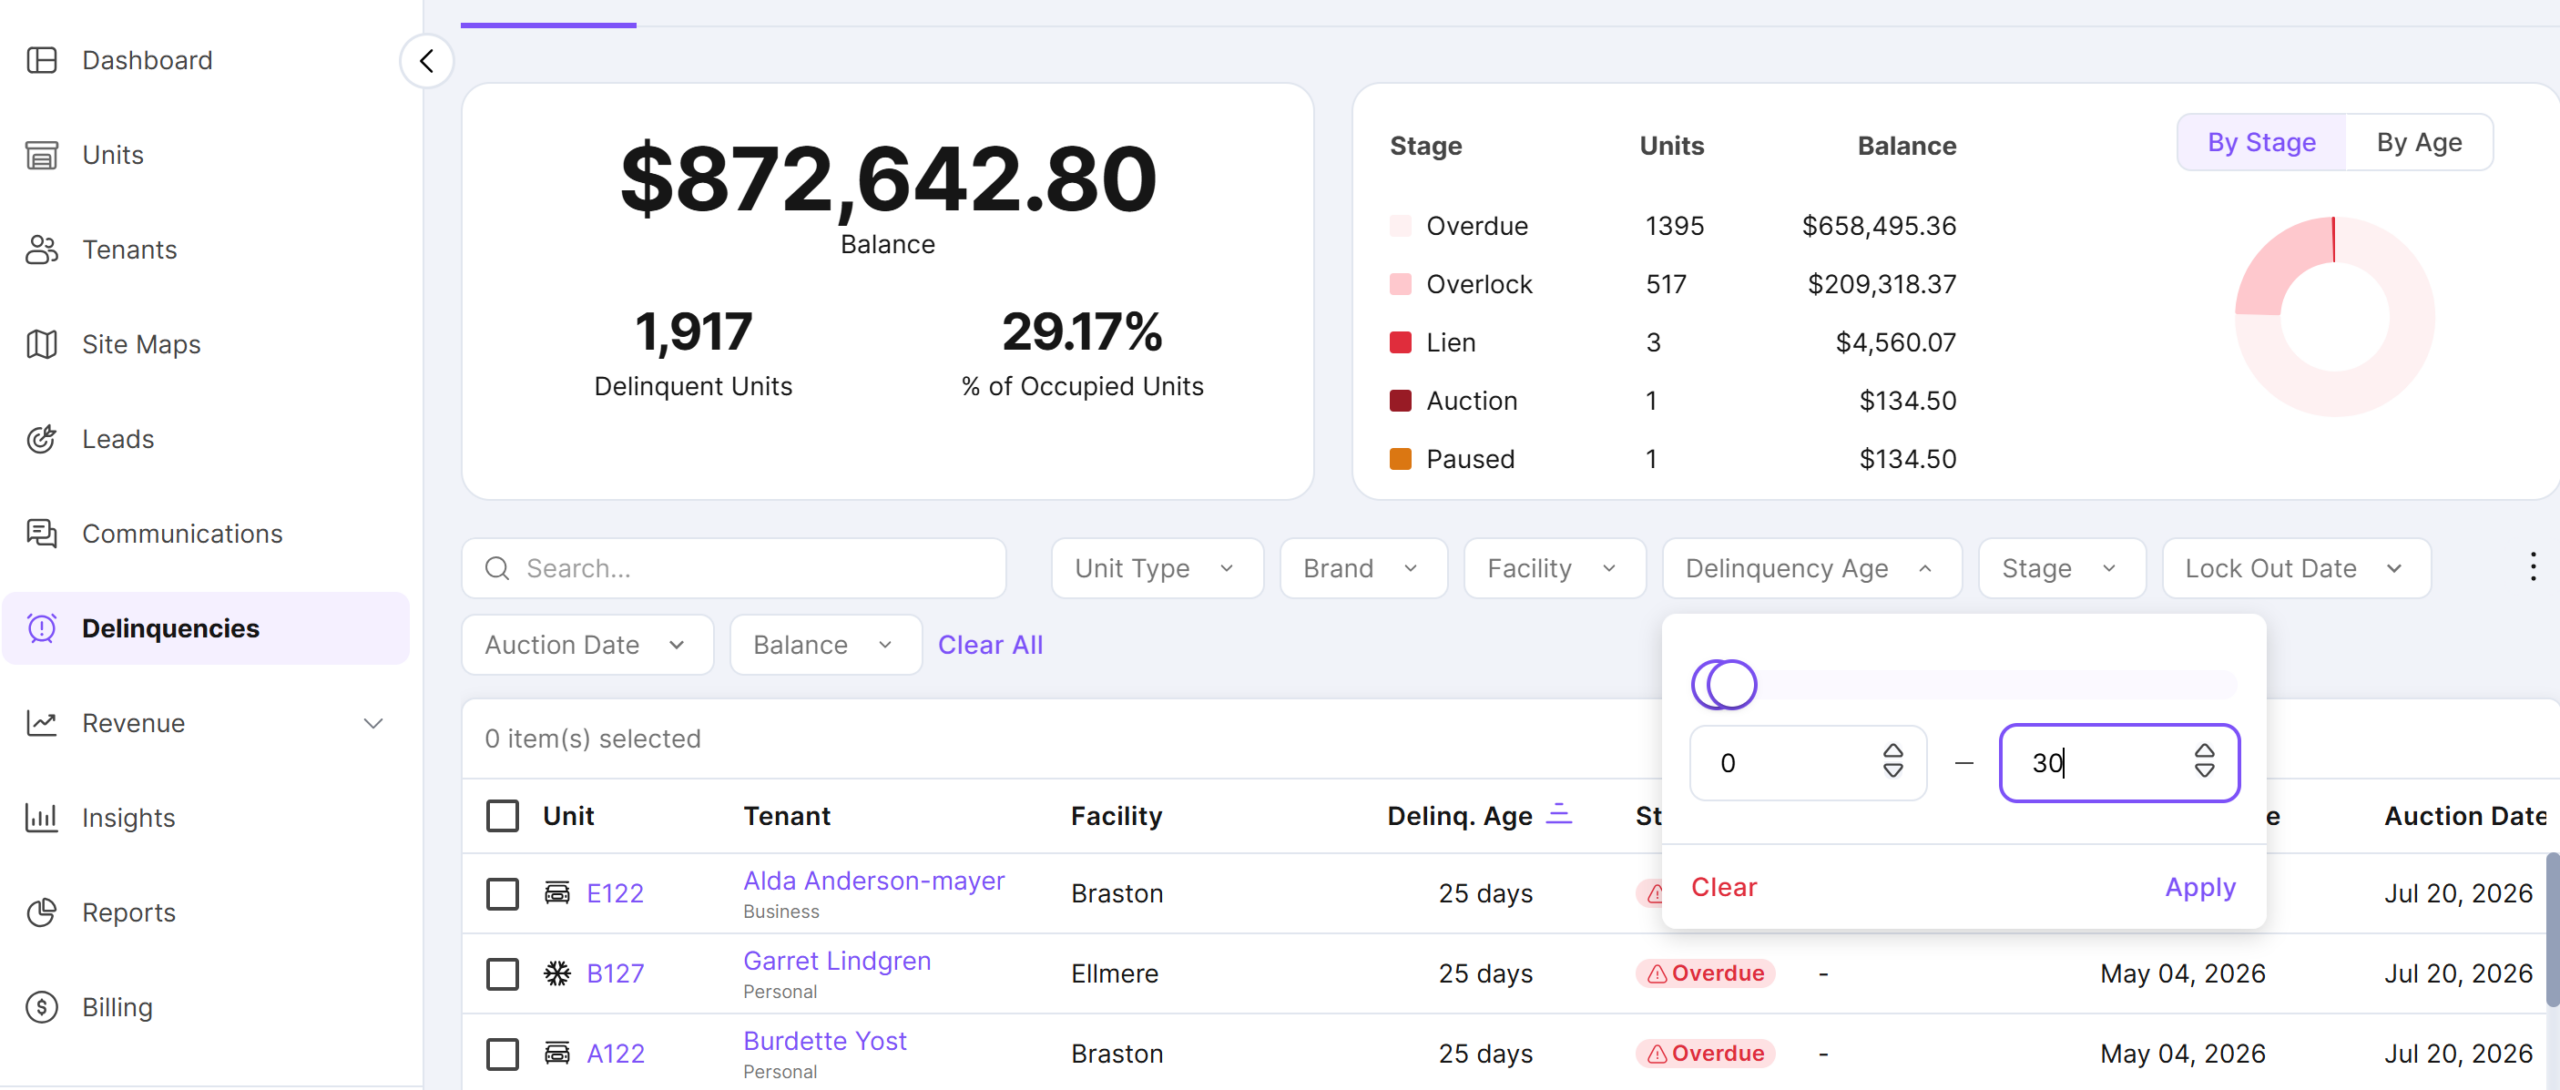
Seeing the full lifecycle matters because by the time a delinquency shows up as a meaningful dollar loss, the window to intervene easily has often already closed. The 30-day mark is critical: payments from tenants that aren’t collected by day 30 become significantly harder to recover. By day 60 or 62, you’re eligible to sell. If you’re only looking at total delinquency as a percentage, you’re missing the early-stage pipeline that predicts where your losses are headed.
The Monument 3PM Dashboard surfaces early-stage units as a predictive warning. This way, you can see potential problems before they start. Let’s say that you have 16 units entering their second month. With the dashboard, you can identify those units before they become a six-figure collection problem.
“Bottom line — our delinquency is here globally. I can see what I need to forward to the team or send to the owner in a couple of minutes. That’s what this does for me.”
— Darren Kelley, CEO, Right Move
Net move is one of the clearest leading indicators of occupancy trajectory. A negative net move ( more move-outs than move-ins) means your occupancy is declining. It’s simple math, but without a dashboard surfacing it in real time across every property, it’s easy to miss until it shows up in your monthly occupancy report.
For lease-up properties, Monument allows you to layer in a monthly target—typically 12 to 15 net move-ins per month to hit lease-up projections. Properties falling short of that target are flagged immediately, giving your regional team time to respond before the month is lost.
These metrics often surprise managers who haven’t seen it visualized clearly before. The gap between your current advertised street rate and the rate your existing tenants are actually paying represents real, measurable revenue that’s being left on the table every month. For example, a 6.8% spread on a 200-unit facility where each unit averages $120–150 can translate to $20,000–25,000 or more in annualized unrealized revenue.
Multiply that across a portfolio of 20 properties, and you’re looking at a significant opportunity that most operators can’t see because they’re not tracking it at the portfolio level. Monument surfaces this gap as a percentage and as an annualized dollar figure for every property on your dashboard.
Existing Customer Rate Increases are one of the highest-leverage revenue tools in self-storage, but their effectiveness depends entirely on execution. The ECI Capture Rate measures the percentage of eligible tenants who actually received a rate increase versus those who were eligible but not acted on.
So if you had 180 eligible tenants and sent increases to 140 of them, your capture rate would be 78%. Monument’s default target is 88% or above. Every percentage point below that is a revenue gap that’s both quantifiable and fixable. This metric is new to most third-party operator dashboards, but it’s one of the most immediately actionable.
Your leasing funnel metrics (total leads by source, active reservations, and lead-to-rental conversion rate) belong on the same screen as your occupancy data. If your physical occupancy is trending down and your conversion rate is dropping, that’s a different problem than if leads are down. Monument surfaces all three, tracked by source, including Google My Business, your rental website, and manual entries, so you know exactly where your pipeline is healthy and where it needs attention.
Closely related to the delinquency rate, the linkage rate tracks the proportion of tenants who are tied to delinquent accounts by unit count and by dollar value. This metric helps identify the properties where a small number of tenants are responsible for a disproportionate share of your collection exposure. In practice, the 80/20 rule applies here: often 20% of your delinquent accounts represent 80% of your dollar exposure. Seeing this clearly is the first step to addressing it.
Tenant retention is a leading indicator of long-term revenue stability. Monument calculates this as move-outs divided by total occupied units on an annualized basis. A healthy third-party self-storage portfolio should target 82% to 88% annual retention. In the current market, losing more than 20% of your tenant base annually suggests a potential issue with customer service, facility security, or an aggressive over-pricing strategy that is driving ‘sticky’ tenants away.
As Monument’s integration ecosystem expands, additional operational KPIs, including unresolved maintenance ticket counts by facility, will naturally surface directly in the 3PM Dashboard. But the goal is always the same: give the operator a complete picture of portfolio health without requiring them to log into a separate system to get it.
| KPI | Definition | Benchmark / Target | Strategic Signal |
| 1. Physical & Economic Occupancy | Physical units rented vs. actual revenue collected. | 85% (Stabilized); 90%+ (High Performant) | Gap signals high concessions/delinquency; >95% signals need for rate hikes/expansion. |
| 2. RevPAF | Revenue Per Available Square Foot. | Varies by asset class/market | The “CEO-level” metric; identifies underperforming unit types (e.g., Climate vs. Non-Climate). |
| 3. Delinquency Lifecycle | Tracking late payments from Day 1 to Auction. | 30 Days (Critical window) | Predictive warning; Day 30 is the cutoff for easy recovery; Day 60+ signals imminent loss. |
| 4. Move-In/Out Net Flow | The difference between new rentals and move-outs. | 12–15 net moves/mo (Lease-up) | Leading indicator of occupancy trajectory; negative flow warns of declining occupancy. |
| 5. Street vs. In-Place Gap | Difference between advertised rates and what current tenants pay. | Market-dependent | Visualizes “unrealized revenue”; a small % gap can equal tens of thousands in lost annual income. |
| 6. ECI Capture Rate | % of eligible tenants who actually received a rate increase. | 88% or higher | Measures execution of revenue tools; any shortfall is a quantifiable and fixable revenue gap. |
| 7. Funnel & Conversion | Total leads and reservations vs. actual rentals. | High conversion (Source specific) | Determines if occupancy issues are caused by a lack of leads or a failure to close them. |
| 8. Delinquency Linkage | Proportion of total dollar exposure tied to specific accounts. | The “80/20” Rule | Identifies if a small group of tenants represents the majority of financial risk. |
| 9. Tenant Retention | Annualized move-outs divided by total occupied units. | 82% – 88% | Below 80% signals issues with customer service, security, or unsustainable pricing. |
| 10. Unresolved Maintenance | Open facility tickets and operational issues. | Zero/Low backlog | Provides a snapshot of property health and manager oversight without extra logins. |
Displaying KPIs is the baseline. What separates a reporting tool from an operational command center is what you can do with the data and how fast you can do it.
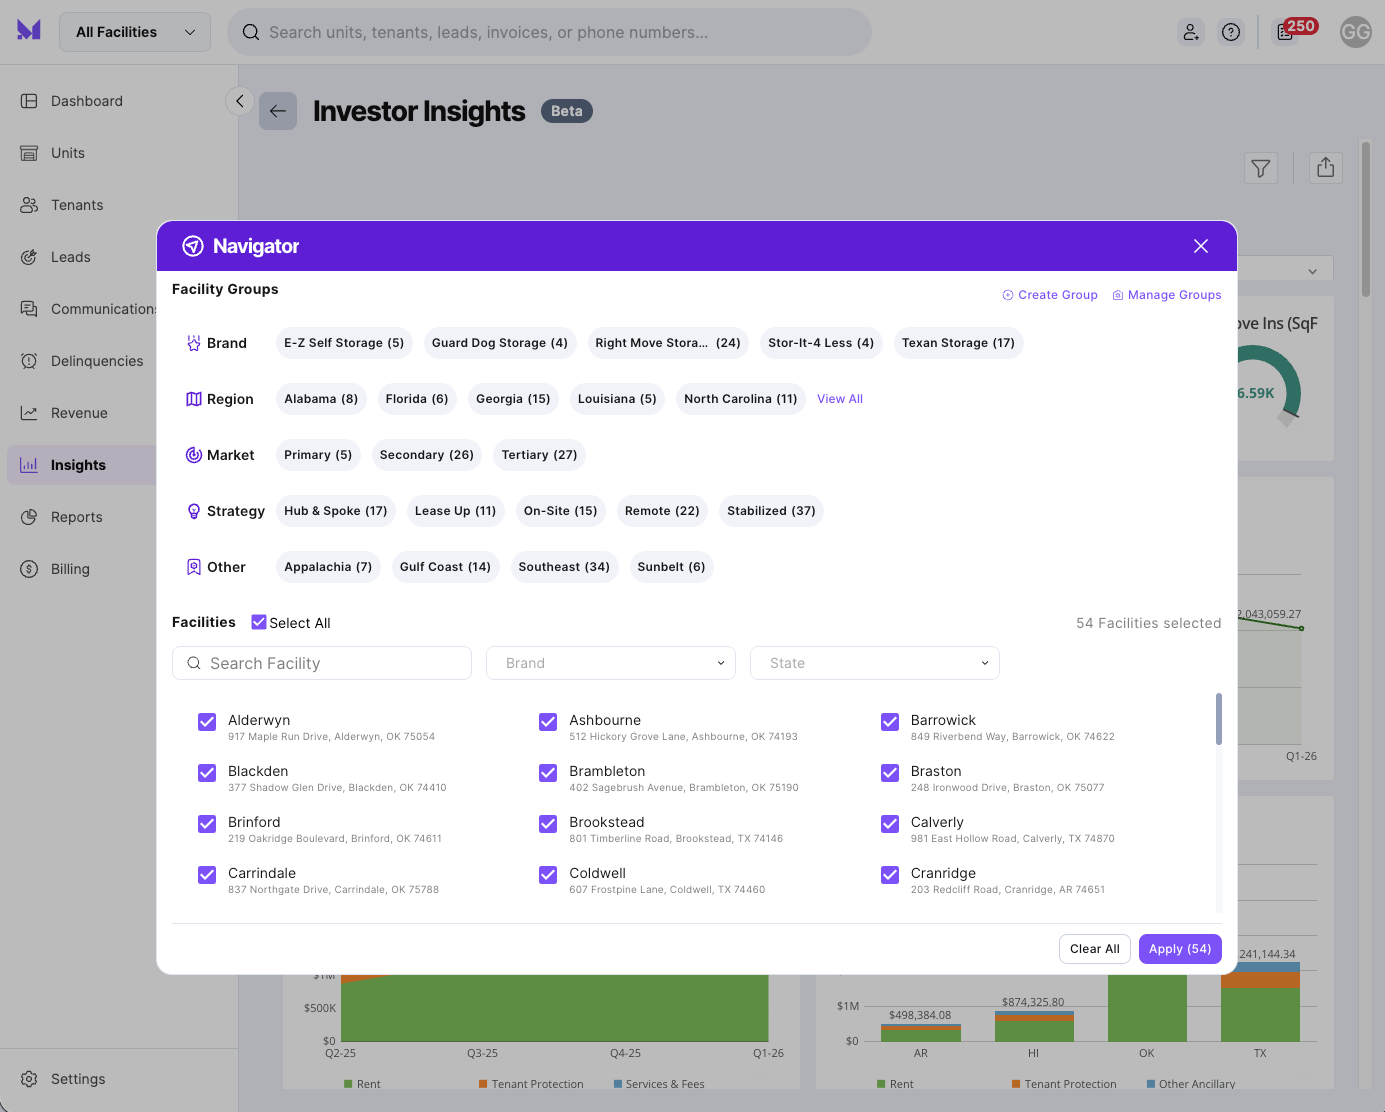
The 3PM Dashboard starts at the global portfolio level (all brands, all regions, all properties). From there, the navigator lets you filter down to a specific brand, a specific region, or a specific property. Every card on the dashboard updates dynamically as you drill.
Every KPI card supports configurable targets per property and per brand. Set a 90% physical occupancy target for your stabilized properties and a 12/month net move-in target for your lease-up facilities. The dashboard shows you a target line on every chart so you can see at a glance whether you’re above or below without needing to scan numbers.
A lease-up property at 45% occupancy is on track. A stabilized property at 45% occupancy is a crisis. The Monument 3PM Dashboard distinguishes between the two, applying the appropriate benchmarks so your view of portfolio health is accurate.
Any card, any filtered view, any subset of properties can be exported and emailed directly from the dashboard. Your regional manager gets exactly the slice they need. Your property owner gets a performance snapshot without you having to build a report from scratch. Your district managers get the same data-driven context you’re working from, which sharpens everyone’s thinking across the organization.
The operators who win at third-party management over the next decade will be the ones who can move faster, see more clearly, and demonstrate value more credibly than their competitors. That advantage doesn’t come from working more hours, it comes from working with better information.
A centralized KPI dashboard should be a core part of your software infrastructure. It’s how you scale without adding headcount, catch problems before they compound, and build the kind of data-driven reputation that wins new management contracts.
Monument’s 3PM Dashboard was built in direct partnership with the third-party operators who needed it most. It reflects the real questions operators ask every morning when they look at their portfolio and answers them in seconds.
A third-party management (3PM) dashboard is a centralized analytics interface that gives third-party self-storage managers real-time visibility into KPIs across all the brands and properties they manage on behalf of owners. Unlike standard facility dashboards, a 3PM dashboard aggregates data globally while allowing drill-down to the brand, region, or property level.
For third-party managers, tracking the right data is the difference between a stagnant asset and a high-performance portfolio. Here are the most important KPIs for monitoring health and driving value:
| KPI | What It Measures | Why It Matters for Third-Party Managers |
| Physical & Economic Occupancy | The percentage of units filled vs. the percentage of potential rent actually collected. | Reveals the revenue gap caused by discounts, concessions, or unrented space. |
| RevPAF (Revenue per Available Square Foot) | Total revenue divided by the total square footage of the facility, broken down by unit type. | The most accurate way to compare performance across different unit sizes and locations. |
| Delinquency Rate | The percentage of tenants behind on payments, tracked through the full collection cycle. | Identifies potential cash flow issues and the effectiveness of automated collection tools. |
| Net Move-In/Move-Out Flow | The total number of new rentals minus the total number of vacated units (Absorption). | Indicates whether the facility is growing, shrinking, or stabilized. |
| Street vs. In-Place Rate Gap | The difference between what new customers pay and what existing tenants are paying. | Signals when it is time to trigger a new cycle of rent increases (ECRIs). |
| ECRI Capture Rate | The percentage of tenants who stay and pay after receiving a rent increase notice. | Measures tenant price sensitivity and the success of revenue management strategies. |
| Lead Conversion Rate | The percentage of inquiries or web visits that turn into completed rentals. | Directly tracks the ROI of marketing spend and the efficiency of the sales funnel. |
| Tenant Retention Rate | The average length of stay for a customer in the facility. | High retention lowers turnover costs and provides a stable foundation for long-term NOI. |
Standard FMS dashboards are built for single-facility or single-brand operators. Monument’s 3PM Dashboard was designed specifically for multi-brand, multi-property third-party managers — with cross-brand aggregation, configurable per-property KPI targets, and the ability to distinguish between stabilized and lease-up property benchmarks. It also supports direct export and email sharing to regional and property teams.
The 3PM Dashboard is part of Monument’s Analytics & Insights offering, available on Pro and Enterprise plans. Contact our team to discuss the right plan for your portfolio.
The difference between a struggling portfolio and a high-performance asset comes down to visibility. As institutional capital raises the stakes for reporting and transparency, third-party managers can no longer rely on the manual spreadsheets of legacy systems.
The path to scaling without adding overhead lies in professional-grade tools like Monument’s 3PM Dashboard. By centralizing the metrics that truly drive Net Operating Income—such as RevPAF, ECI capture rates, and delinquency lifecycles—operators can move from reactive site management to proactive asset management. Ultimately, automation and real-time data are the force multipliers that allow sophisticated operators to break through the complexity ceiling, delivering elite results for ownership groups while maintaining total control over their growth.
Stop managing through spreadsheets and start leading with data. Book a demo with Monument today to see how our 3PM Dashboard can transform your portfolio’s performance.


Explore top self-storage software solutions with key features, comparisons, and tools for facility operations, marketing,...

Explore top facility management software systems for self-storage, including key features, benefits, and how these...

Discover how 3rd party self storage management improves operations, revenue, and NOI—and what to look...